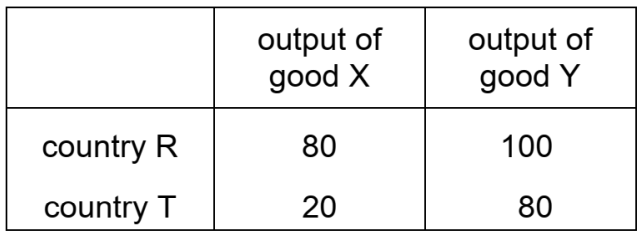
20191111-21: The table shows the amount of good X or the amount of good Y that can be produced by country R and country T if each uses all of their resources.
What can be concluded from the table?
Correct!
Wrong!
Wrong!
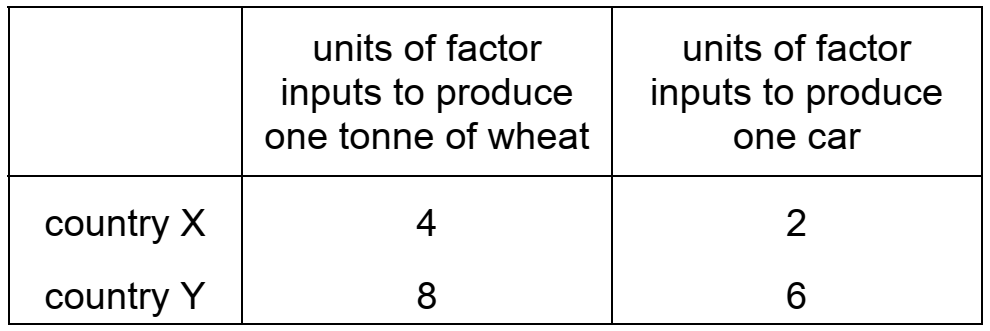
20191112-23: The table indicates the factor inputs required to produce wheat and cars in countries X and Y.
What makes it possible for both countries to benefit from trade?
Correct!
Wrong!
Wrong!
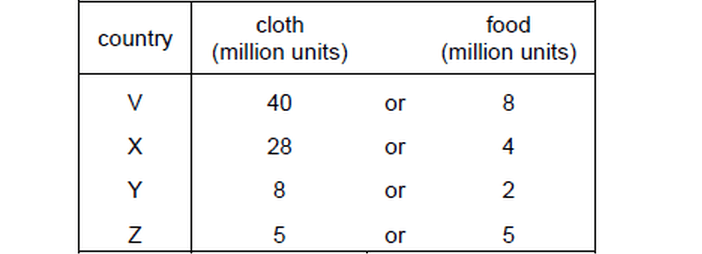
20181112-26: The table shows the production possibilities of cloth and food in four countries using all of their resources.
If the world exchange rate is 1 unit of food for 6 units of cloth, with whom is V likely to trade?
Correct!
Wrong!
Wrong!
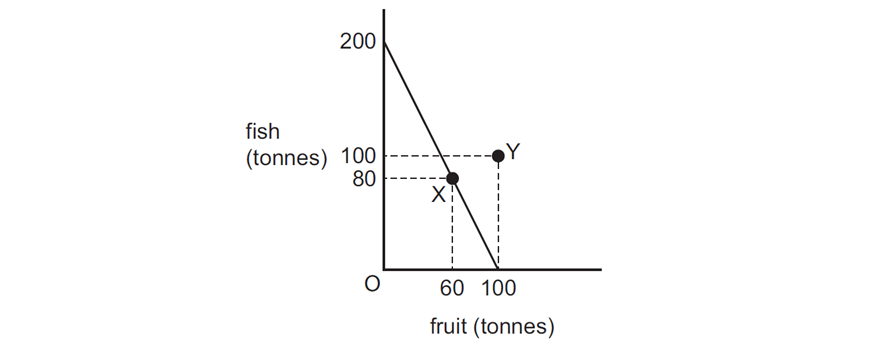
20140613-19: The production possibility curve shows island J’s ability to produce fish and fruit. It specialises entirely in fish in which it has a comparative advantage and trades fish for fruit from island K.
As a result, island J increases its consumption from 80 tonnes of fish and 60 tonnes of fruit, point X, to 100 tonnes of fish and 100 tonnes of fruit, point Y.
What was island J’s exchange rate of fish for fruit?
Correct!
Wrong!
Wrong!
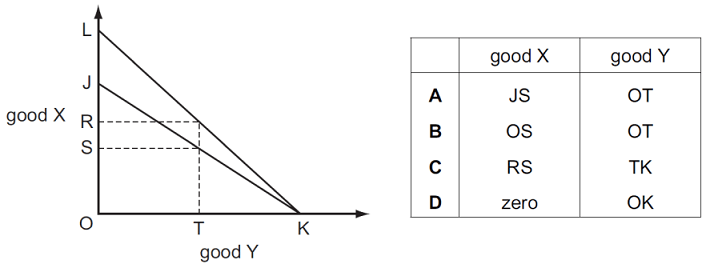
In the diagram, JK is a country’s production possibility curve.
LK is its trading possibility curve which shows possible combinations of good X and good Y after specialising in the product in which it has comparative advantage, and then trading this product.
The country consumes OR of good X and OT of good Y.
Which quantities of goods X and Y does it produce?
Correct!
Wrong!
Wrong!